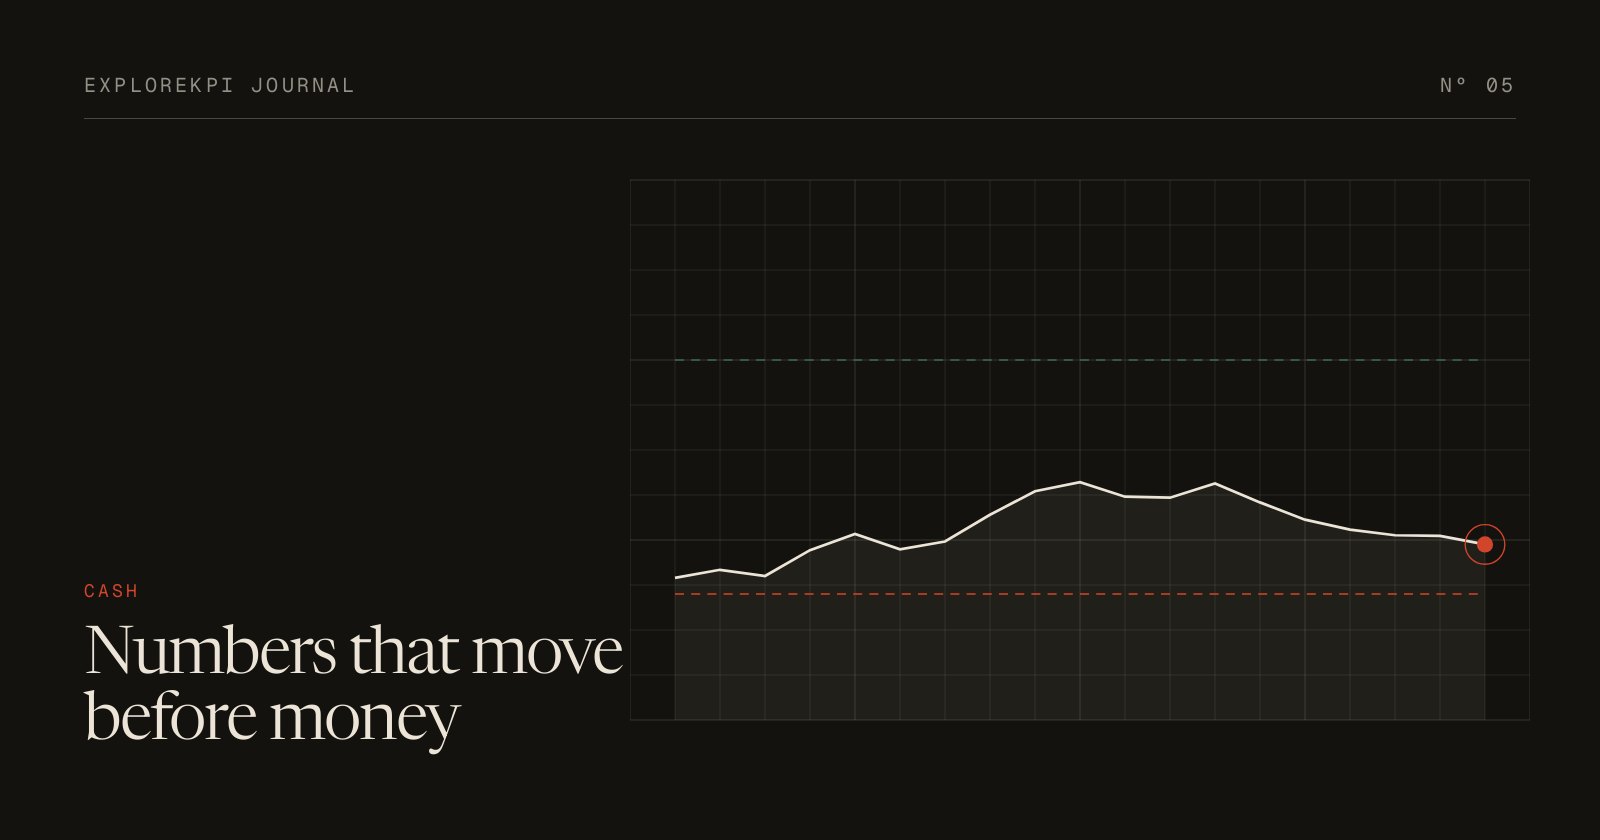
Most small companies that run out of money were profitable on paper the month before. That sentence sounds like a paradox until you have lived it: the orders are there, the invoices are out, the margin is fine, and the account is empty because the customers have not paid yet and the suppliers want paying now.
The bank balance is the most honest number in the business and also the slowest. It tells you, precisely and too late, what has already happened. If you want time to react, you need the numbers that move first.
1. Days sales outstanding
DSO is the average number of days between sending an invoice and receiving the money. Take the receivables at the end of the month, divide by that month's revenue, multiply by the number of days. If you invoiced €90,000 in a 30-day month and €75,000 is still unpaid at month end, your DSO is 25 days.
The level matters less than the direction. A DSO that drifts from 38 to 47 days over a quarter means that roughly nine days of revenue are now sitting in your customers' accounts instead of yours. For a business turning over €1.2 million a year, that is about €30,000 of cash that has quietly disappeared, with no change in profit at all.
When DSO starts to rise, look at the ageing list: is it one large customer paying late, or everyone paying a little later? The first is a conversation. The second is usually a process problem, such as invoices going out late, or with errors that give customers a reason to wait.
2. Pipeline coverage
For businesses that sell projects or contracts, the cash of three months from now is being decided in the sales pipeline today. Coverage compares the weighted value of open deals with the revenue you need over the same period. If you need €150,000 next quarter and the probability-weighted pipeline is €180,000, coverage is 1.2.
Each company learns its own safe level, but most find that below 1.0 there is no realistic way to hit the number, and the gap will show up in the bank in about one sales cycle. A falling coverage ratio is the earliest cash warning available, often a full quarter ahead.
3. Order-to-invoice lag
This is the time between doing the work, or shipping the goods, and sending the invoice. It is invisible in most reporting and surprisingly often longer than anyone thinks. Projects that are "basically finished" wait for a final sign-off. Hours are logged at the end of the month. Someone is on holiday.
Every day of lag adds a day to the time before you are paid, on top of the customer's payment terms. Cutting it is entirely within your control, which makes it one of the cheapest sources of cash there is.
4. Inventory days
For anyone who holds stock, inventory is cash in another form, and not a liquid one. Inventory days measures how long, on average, goods sit before they are sold: stock value divided by the cost of goods sold, times the number of days in the period.
A rise in inventory days usually means one of two things. Either sales are slowing and the buying plan has not caught up, or a few lines are not moving at all. Both are worth knowing before the quarterly stock-take.
5. Fixed-cost cover
The last number is a simple ratio: cash in the bank divided by monthly fixed costs. It answers the question every owner asks at 3 a.m.: how many months could we keep the lights on if revenue stopped? Three months is uncomfortable. Six is reasonable. The exact target depends on how quickly your revenue could recover after a shock.
This is the one lagging number on the list, but tracked monthly, it turns the vague anxiety into something you can plan around.
Reading them together
The point of the leading indicators is not to predict the future exactly. It is to buy time. A falling pipeline seen in September can be met with a campaign. The same fall seen in December, through the bank account, can only be met with cuts.
None of these numbers needs a finance team. DSO and inventory days come straight from the accounting system. Coverage comes from the CRM. Order-to-invoice lag usually needs a small change in habit: noting the date work is finished.
In ExploreKPI, each one becomes a KPI with a target and a minimum, grouped under the financial perspective of the scorecard. When two or three of them cross their minimums at the same time, the business health score drops, and that drop is the conversation you want to have in September rather than December.